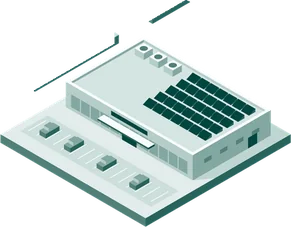
Energy management means monitoring and improving your buildings' energy, costs and emissions continuously. It covers electricity, district heating and water, contracts and bills, the profitability of investments, and energy and sustainability reporting. We do this with your team all year round.
This yearExample
Energy by building
Electricity−6 %
District heating−3 %
Compared with last year.
01
Electricity, district heating and water in one view
Consumption, costs, consumption per m² and emissions by building and by use, compared with earlier periods.
You see at a glance which buildings use more than they should. Changes show up month by month, so nothing slips through. Your team no longer has to collect figures from several portals.
Bill checkedExample
October bill, office building
Matches consumption and contract.
Contract ends in 4 months
02
Bill and contract checks
We compare bills with consumption and contract terms and flag errors, explaining each one. When your electricity contract is about to end, we help you compare the options and prepare the renewal.
You no longer pay for errors that nobody had time to spot. You also know well in advance when a contract is about to end.
Anomaly spottedExample
Office building
Night-time use has been up for three weeks.
Check now
03
Real-time monitoring and alerts
In buildings where it pays off, our own metering devices show consumption and power demand in real time, and anomalies trigger an alert so you know what to tackle first.
Night-time use and faults show up within days, not on the next bill. Each alert tells you which building it is and how urgent it is.
Calculation readyExample
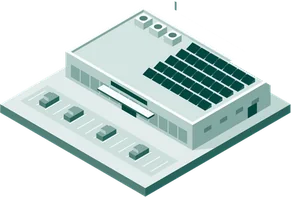
Solar power, retail building
Payback calculated from your own consumption.
04
Calculations before investing
We help you compare investments at portfolio level: in which buildings solar power, batteries, EV charging points or a change of heating system pay off, calculated from your own consumption.
We get involved at the planning stage, while the options are still being weighed. For example, we simulate how EV charging affects a building's power and costs. You see which options pay off and in which order to take them forward.
ReportingExample
Emissions, Scope 1 and 2
Scope 1
Scope 2
Energy Efficiency ActETJ+VSMEESRS E1
05
Figures for sustainability and energy reporting
Energy and Scope 1 and 2 emissions figures for the Energy Efficiency Act, ETJ+, VSME and ESRS E1, plus the property section of your carbon roadmap, all from the same data.
The figures come from the same data as your costs, so the numbers always match. Reporting season no longer means weeks of spreadsheet work.
ReadyExample
Annual report for owners ready
Open report
06
Reports for management and owners
You get a monthly review, a quarterly report and an annual report for your board and owners, automatically.
Each report says what changed, why it changed and what we recommend next. It is written so that a board member can read it without an energy background.
This yearExample
Energy by building
Electricity−6 %
District heating−3 %
Compared with last year.
Bill checkedExample
October bill, office building
Matches consumption and contract.
Contract ends in 4 months
Anomaly spottedExample
Office building
Night-time use has been up for three weeks.
Check now
Calculation readyExample
Solar power, retail building
Payback calculated from your own consumption.
ReportingExample
Emissions, Scope 1 and 2
Scope 1
Scope 2
Energy Efficiency ActETJ+VSMEESRS E1
ReadyExample
Annual report for owners ready
Open report
Finances, energy and sustainability from the same data.
You see the whole portfolio in one view and know what your own team should solve and what to ask of your other partners. You get the reports ready.
Start with one building.
A free energy analysis of one building shows what your whole portfolio could hold.